
case study
Online baby and children’s
clothing store
BERNI


Location
Ukraine

Start date
November 2017

Category
Fashion

View
Website 
Task
- Reduction of the conversion cost;
- Increase in ROMI;
- Increase in the number of conversions;
- Customer attraction from social networks;
Project features
- The conversion cost should not exceed $12;
- ROI shall not be less than 250%;
- Low activity in social networks at the time of starting of the work;
- Orders are not accepted via direct messages, through the website only;
- Many agencies have worked on the promotion campaigns since 2014;
Google Ads

Google Analytics

Google Merchant Center

Facebook Ads
Instagram Ads

Shoppable posts

Influencers
Tools and services
Project desciption
The Berni online store sells children's clothing under its own brand. For children from the smallest to adults throughout Ukraine.

Solution
During the initial audit of the Google Ads account, typical errors were identified: the confusing structure of the advertising account, a lot of intersections in search queries, the absence of some advertisement extensions, and errors in the configuration of the promotion campaigns.
First of all, we corrected all technical errors in the configuration of the promotion campaigns and updated the structure of the advertising account. We made the structure of the Google Ads account more transparent and logical, in accordance with the structure of the site itself.
An important point was the analysis of the profitability of the promotion campaigns by region and adjustment of the rates by various parameters: by region, by device, and by impression time. Our decisions were made based on the statistics we obtained from Google Ads and Google Analytics for last 12 months.
We also studied the negative keywords in details: we expanded the number of queries, removed some of the existing queries that cut off the target traffic, and performed “cross-minus” by the groups of advertisements in the campaigns. We redesigned the banners for the dynamic remarketing. We launched promotions.
After launching of the updated campaigns, we analyzed the associated conversions and corrected problems in the configuration that had an effect on decrease in the overall sales volume.
After obtaining the first results, we identified the categories of the leading products and focused just on them. We scaled the most profitable campaigns: we expanded their semantics and increased their budgets.
A month later, we analyzed the promotion campaigns that showed lower results and reallotted the budget in favor of more effective campaigns.
As a result of comparison of the statistics on our campaigns and on previous ones the following results were obtained:
A little later, the use of the automatic rules was started to reduce the daily budgets on weekends and for their return on Monday, as well as the use of the rules for automatic adjustment of the positions of the advertisements in search results was started too.
With the help of split tests of the advertisements, we identified the most conversion elements: calls for action, titles, and texts, and we used them in the context of each group.
We carried out the Google Ads experiments with the use of various conversion strategies. The “Maximum conversions” strategy and the classic manual setting of the rate were the best in terms of acquisition value.
As a result, we reached a stable ROMI level of more than 400%. And the average cost of the customer acquisition is 216 UAH.
Comparison of ROAS indices before and after optimization of the promotion campaigns:

In March 2018, with the introduction of the Google Shopping campaigns, this option was immediately enabled for the client’s account. During the first several months, the campaigns did not almost spend the funds and did not bring any results, but starting from July, the volume of sales sharply increased. As a result, the effectiveness of the shopping campaigns was higher than the usual campaigns on search results. It was decided to reallocate the budget in favor of the Google Shopping campaigns:

Since May 2018, we also started working on customer acquisition from the social networks for the online store.
Initially for the baby and children’s clothing store the target audience was determined, and the content strategy and the content plans were developed, taking into account the specifics of each of the social networks (Instagram, Facebook). Thanks to the well-developed strategy, a regular posting of the publications was organized using the Later service, which allows to plan publishing of the posts, and the single style was chosen for the Instagram feed.

To make it easier for users to go to the website from Instagram, we enabled the service that allows to make multiple links – linkin.bio. We also started actively to use Instagram Stories with built-in links leading to the site that were not previously published in the account.
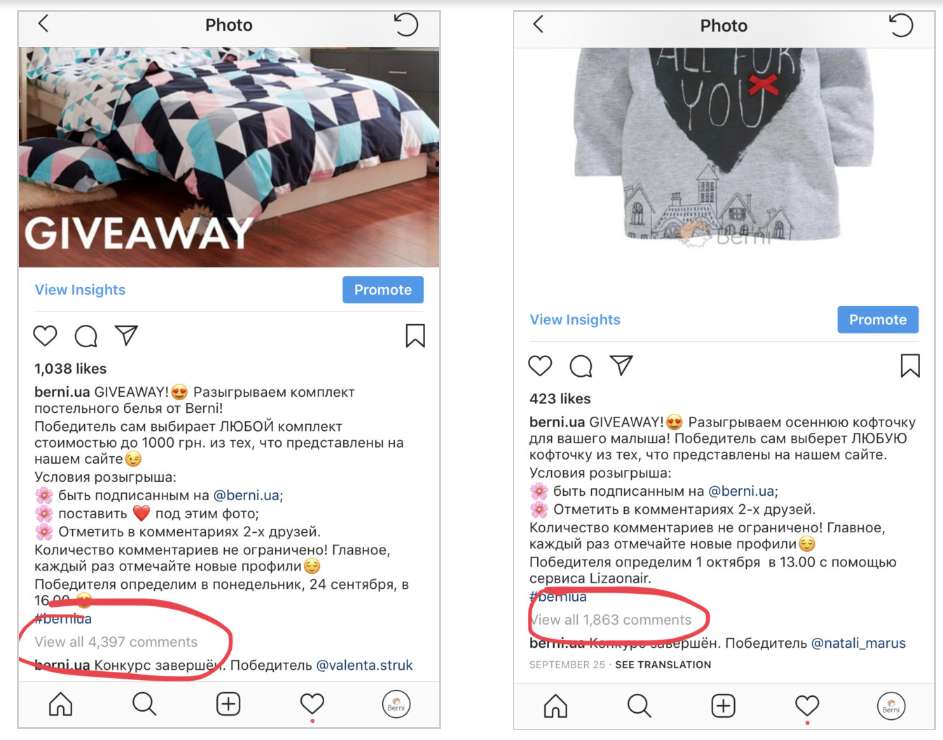
Regular product drawings were held to increase the involvement in the accounts and the audience loyalty. The most popular among the audience were drawings of sets of bed clothes – such competitive posts obtained more than 4,000 comments during the period of 5-6 days, during which the drawing was held.
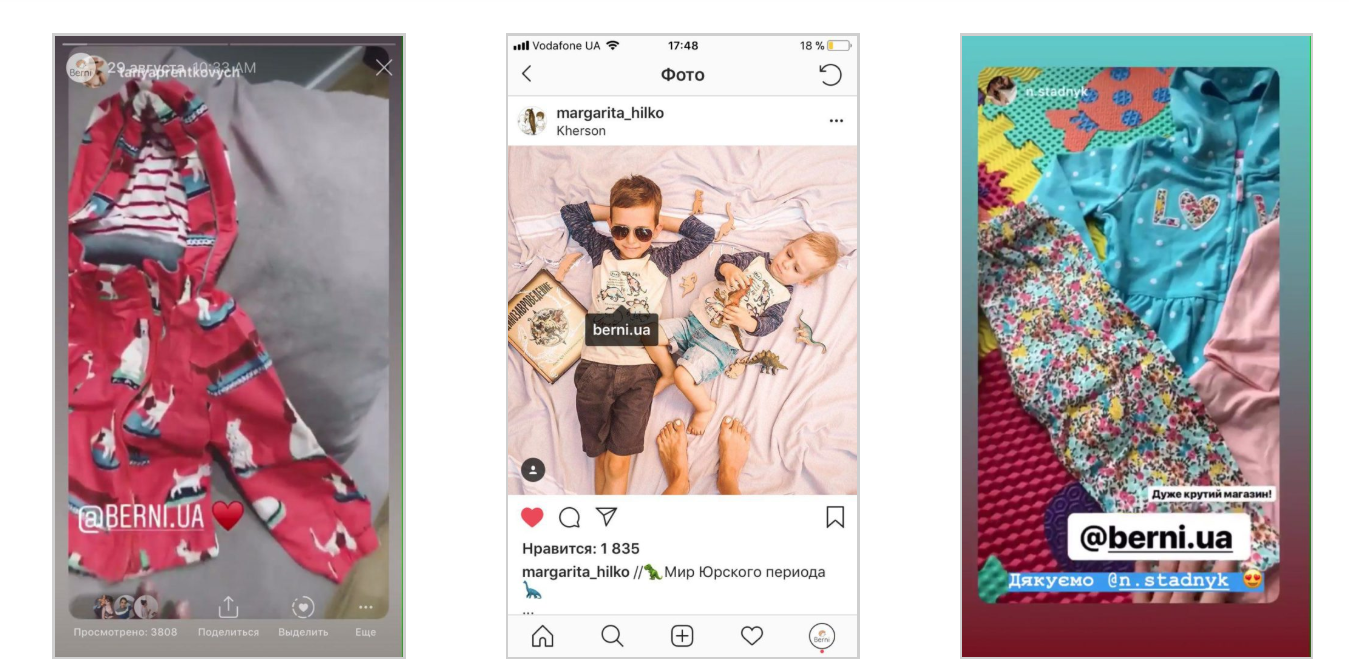
Opinion leaders whose main blog topic is motherhood were selected for cooperation. We also paid attention to the activity on the bloggers ‘ pages — the involvement coefficient (the ratio of the number of likes to the number of followers of the page) should not be less than 4-5%.
Among them such famous bloggers are as Tanya Prentkovich (289K followers), Nastya Stadnik (305K followers) and Mila Baraeva (158K followers). They made reviews on the products we sent, what resulted in increase of coverage in the account and in increase of the number of followers on the page in Instagram. For example, on the day when Nastya Stadnik published the stories about Berni, the activity in the profile increased more than three times. The number of profile views increased to 6,200, while the average daily profile traffic is 1500-2000 thousand persons.
We also started publishing screenshots of reviews and photos made by the customers, what increased the level of confidence in the store.
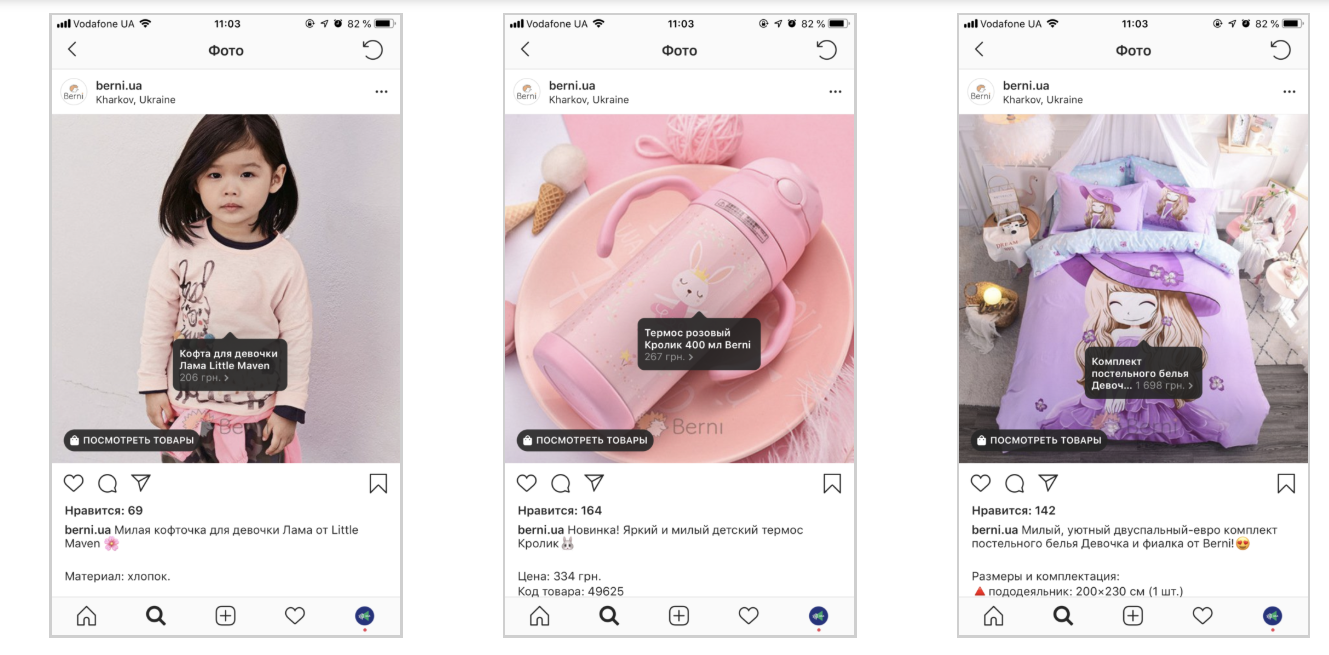
Later, we added the feature that makes it possible to publish Shoppable posts in the Instagram account. This again increased the conversion rate from Instagram, since the user no longer had to go to the additional linkin.bio page, and he or she went directly to the page of the selected product:
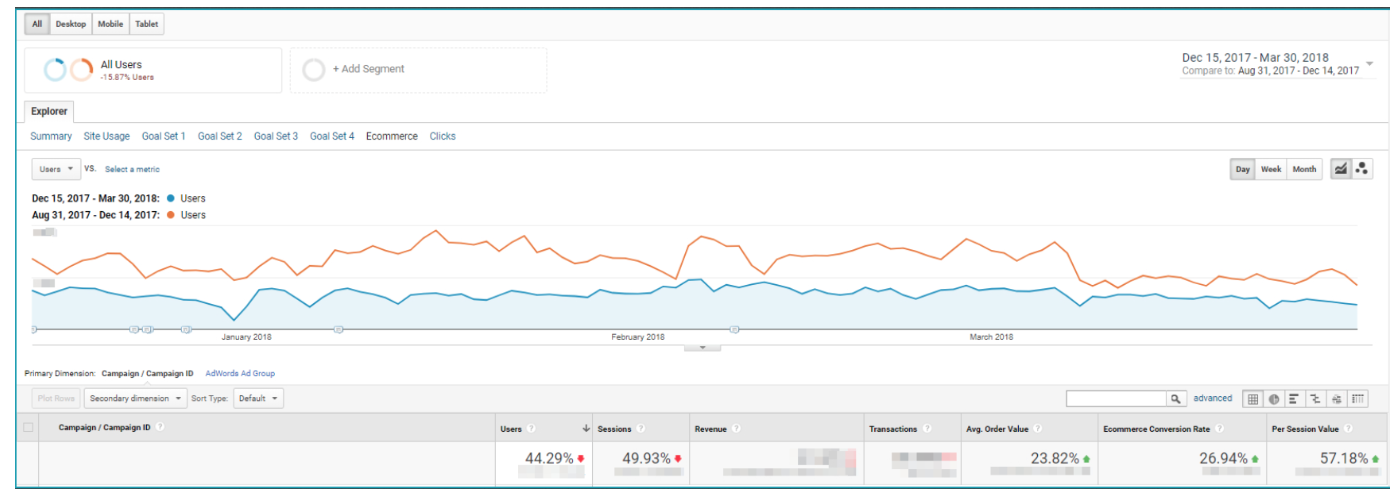
Since it was decided to consider the number of orders on the website but not the level of the user’s involvement in social networks as the main task when maintaining the account, so we also evaluate the results by the number of transactions on the site from social networks. The growth of transactions from social networks after starting of the work is shown below:

As a result of our work, the number of sales from paid search and social networks continues to grow, and we continue to optimize the performance of the accounts and the results.
UPD: April 2020
More than one year has passed since the case was written. A lot of things changed, and we decided to make a small update.
During this period, a huge number of tests were made in advertising. Dozens of hypotheses have been put forward. We used all available Google Ads and Facebook Ads tools to scale the results. Let’s study some of them:
Google Ads:
- Testing of various strategies on setting of the rates. Recently, Google has done a lot of work to improve the automated strategies, and this brought the visible results. Campaigns with Return On Advertising Spend strategies (ROAS) show the results better than manual strategies. When changing to a new strategy, you should be careful, because there is a risk of losing sales and ROAS. The way out for this situation may be use of Google Ads experiments. This tool allows you to devide your campaign and allocate a part of your budget to test your hypothesis and see: if, for example, the new strategy on setting of the rates will work better than the current one. The following strategies were tested for a number of campaigns:
- Target price per each conversion;
- Maximum conversions;
- Target return on investments;
- Maximum conversion value;
It turned out that different strategies work for different campaigns. Depending on the results obtained as a result of the tests, the strategies were distributed among the campaigns with selection of the best one in terms of its performance for each of them.
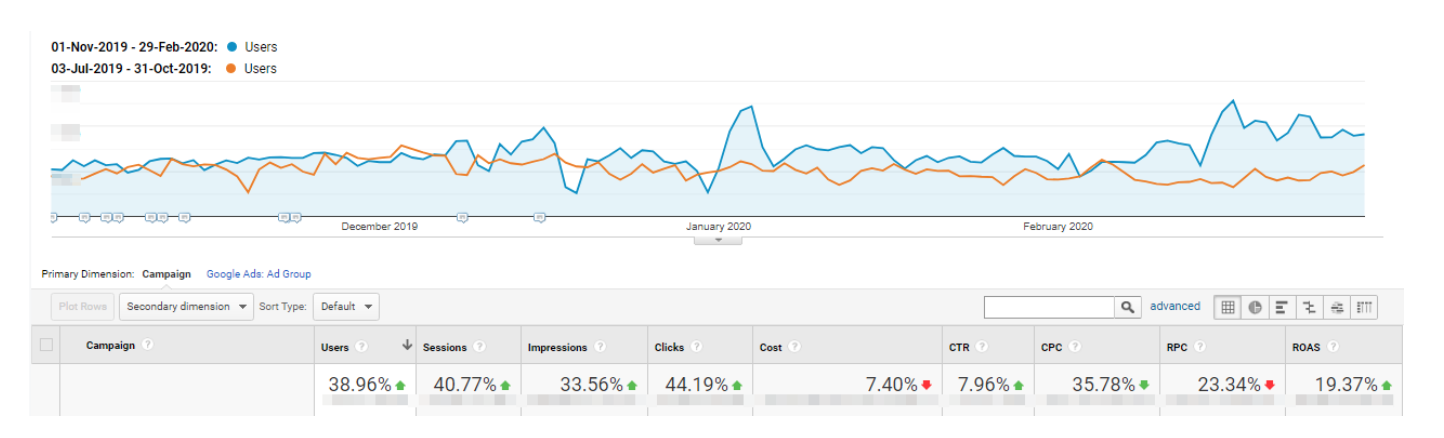
- Change from Google Shopping to Smart Shopping. After obtaining and accumulating the enough volume of statistics, we started changing some shopping campaigns to Smart (smart shopping campaigns). This type of campaigns differs from the usual ones with several features:
- impressions are displayed not only in search results, but also as remarketing in Google Display Network, Youtube, and Gmail;
- Smart Shopping uses existing statistics and machine learning, which allows Google to optimize the impression of the advertisements to users with the utmost probability of conversion with the required ROAS;
As a result, for the shopping campaigns, it succeeded in increasing ROAS by almost 20%, the number of clicks by 44%, and decreased expenses by 7.4%. The number of sales and the returns increased by 15%.
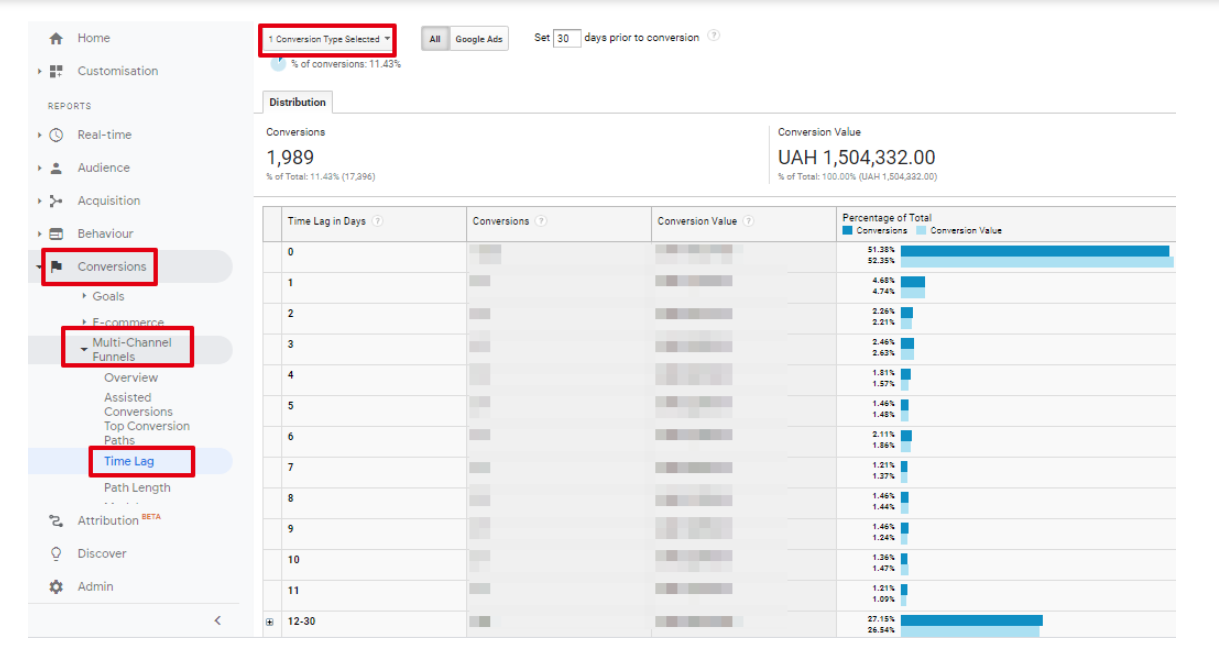
- Segmentation of remarketing audiences. Special attention was paid to this area. After analyzing the statistics, we found out that less than a half of users make a purchase on the first day of visiting of the website. More than 15% of users make a purchase within the first week from the moment they first visit the website. Obtaining this data from Google Analytics, we created several remarketing audience segments for different product groups by the number of days since the first visit and by the days for the abandoned shopping cart. For some of them, we found out that users willingly make a purchase in 2 days after adding of the product to the cart (the cost of conversion is 4 times lower than for other segments by days).
We also tested combined audiences by days and number of pages viewed, what allowed us to identify an active audience with an acceptable cost per each conversion for some certain categories of the website.
How to view conversion statistics from the first visit of the website in Google Analytics:
- Launch of a smart search campaign. Most experienced advertisers do not just use this type of campaign because of its primitive settings, since this type of campaign is designed for users who are doing advertising for the first time. In practice, during the period of the last several months, we have seen good sales figures for this type of campaign for various projects, and we also decided to launch it in test mode. In most cases, we don’t recommend launching this type of campaign as a main campaign, but as a test, it’s a good idea. The result speaks for itself:

Facebook Ads:
- A similar segmentation of remarketing audiences (as for Google Ads) was also made for Facebook. The result of most of the tests was similar to the audience tests in Google Ads.
- Timely launch of the promotional actions of the website for dynamic remarketing campaigns and sale of products from the Facebook catalog. The products on special offers are often purchased more likely, especially if users have already viewed these products on your website before, but have not purchased them. Such promotional actions allow to solve several issues:
- to promote the sales of a product category
- to get rid of remainder
- Give an incentive to start selling a new product category on your website
- make an additional sale
- forced decision due to the market situation.
- Launch of campaigns on cross-sale, sale of additional or more expensive products. Selection of products from similar product groups allows to attract the attention of customers, and demonstration of more expensive products helps to increase the sales return. You can also use this option to sell marked-down goods or promotional products to the audiences who have added items to their shopping cart but haven’t purchased them from this product category.
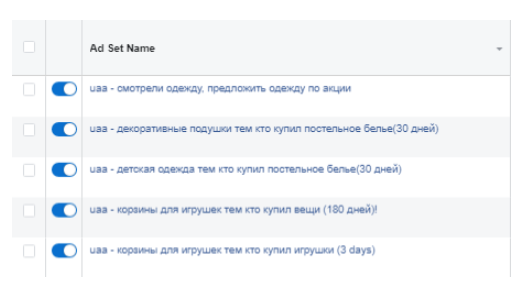
Here are some examples of the audiences:
- Trends and demand are changing. That is why it is recommended to conduct regular analysis and make various product selections of the top-selling products, products that are gaining popularity, and so on.
- Targeting audiences. During the period of working with the account, we have tested a huge number of audiences by interests and formed a certain backbone. it’s par for the course for many advertisers. However, advertisers often forget about the possibility of using their customer base to obtain additional sales. A well-designed strategy and segmentation of the base by the categories of the purchased products and returns can give a good result. Keep in mind that this audience is already familiar with your brand and your website, which increases the probability of a sale. Facebook allows you to load a database of emails or phone numbers and create an audience based on them.
- You can also create various similar audiences (Look-alike) based on your customer base. Facebook will select an audience similar to your customers based on their similarity in interests, behavior, and other characteristics.
+15000
Increase in Instagram followers during the period of 4 months
+12000
Increase in Facebook followers during the period of 4 months
+7.5%
Increase in conversions from social networks
+27%
Growth of transaction coefficient
Results
View other cases

Increase return on advertising investment (ROAS).


ARE YOU READY TO IMPROVE YOUR PROJECT WITH #UAATEAM?
We will be happy to discuss your project, along with your main goals and objectives. You can schedule a meeting with one of our managers.